


Zenitics
Consolidate and analyze key business data to gain clear insights into operations and performance for better decision-making.
Discover new value from diverse business data.

대표전화 : 080-500-2020
Tel : 080-500-2020
Điện thoại : +82)80-500-2020

Digital Transformation Solution No.1
이메일주소 무단수집을 거부합니다.
refuse to collect e-mail addresses without permission.
Từ chối nhận e-mail không có sự cho phép.
본 웹사이트에 게시된 이메일 주소가 전자우편 수집 프로그램이나 그 밖의 기술적 장치를 이용하여 무단으로 수집되는 것을 거부하며,
이를 위반시 정보통신망법에 의해 형사 처벌됨을 유념하시기 바랍니다.
정보통신망이용촉진및정보보호등에관한법률 제50조의2(전자우편주소의 무단 수집행위 등 금지)
Please note that e-mail addresses posted on this website will be refused to be collected without permission using e-mail collection programs or other technical devices, and that violations will be criminally punished under the Information and Communication Network Act.
Xin lưu ý rằng chúng tôi từ chối thu thập các địa chỉ e-mail trái phép được đăng trên trang web này bằng cách sử dụng các chương trình thu thập e-mail hoặc các thiết bị kỹ thuật khác.
Discover new value from diverse business data.
Effectively collect and analyze internal and external business data to understand the business environment and support strategic planning.

Visualize key metrics
with clear charts
and indicators.

Compare and
analyze data with
multiple chart types.

Explore data with
pivot analysis,
Excel export,
and alerts.

Create and manage
content easily
with built-in BI tools.
With more than 50 dashboard templates, you can visualize various metrics, from detailed report data to key performance indicators, and customize colors based on the layout.
Dashboard Templates: Create and modify dashboard templates Dashboard Settings: Apply templates to create, modify, and manage dashboard deployment
Display performance and analysis results using bar, donut, line, and other charts. Customize units, switch chart types, and save charts as images.
Chart Settings: Select, create, edit, and publish charts.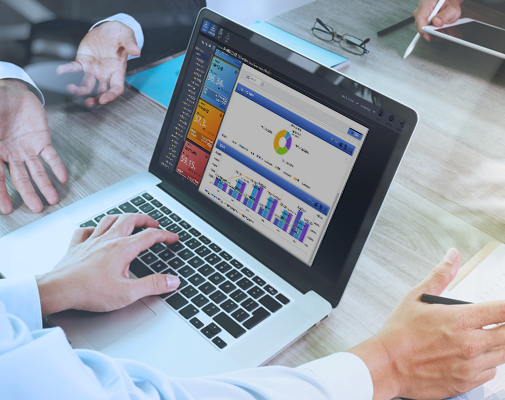
Display detailed data in tables, customize units, export to Excel, and use auto-refresh for monitoring.
Report Settings: Create, edit, and publish reports.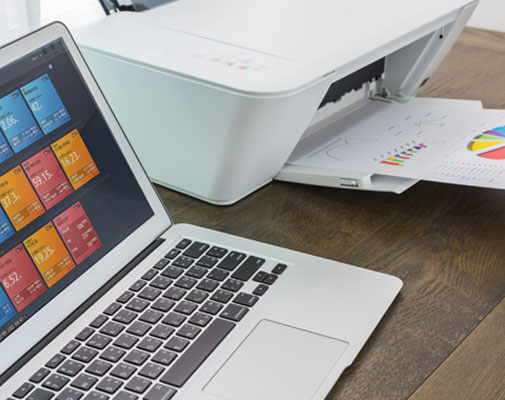
Analyze UNIERP data with drill-down views, flexible layouts, and custom search filters.
Layout Settings: Arrange and resize content, and set search filters.
Analyze UNIERP data through charts and reports, optimized for viewing individual content.
Category Settings: Manage content combinations.
Cycle through KPI content at set intervals to monitor the latest data in real time.

Configure data and visualization settings for each content type.
Content Master: Manage content data Content Hierarchy: Create, edit, and organize content
Manage content access by user and across multiple corporate entities.
Content Permission Management : Manage permission groups User Permissions : Assign and manage permission groups by user
Improve overall management capabilities through company-wide information sharing, analysis, and utilization.

Balanced performance evaluation
Continuous KPI monitoring
Data-driven business strategy
Faster achievement of business goals

Faster management decision-making
Flexible organizational changes
Real-time strategy adjustments

Seamless communication between executives and teams
Standardized reporting processes
Reduced processing time


Copyright ⓒ 2021 BIZENTRO Co., Ltd. All right reserved.